Quarterly sales statistics – overall observations
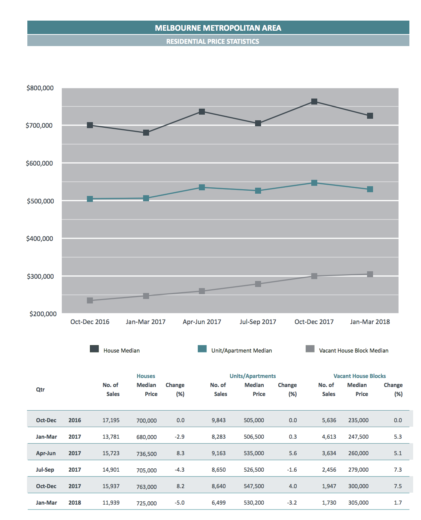
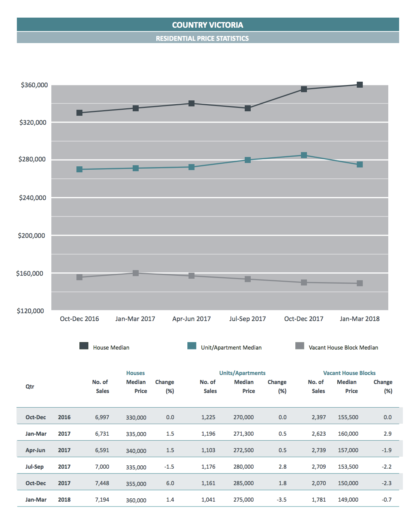
The median price of houses in Victoria decreased by 5.7 per cent from $631,000 in the December 2017 quarter to $595,000 in the March 2018 quarter, having increased by 7.7 per cent in the previous quarter (September 2017 to December 2017). For the 12 months from March 2017 to March 2018, the median house price in Victoria increased 8.8 per cent, from $547,000. The median price of units in Victoria decreased by 3.4 per cent from $517,500 in the December quarter to $500,000 in the March 2018 quarter, having increased by 3.5 per cent in the previous quarter. The median price of units in Victoria for the March 2018 quarter was lower than the median price of houses. For the 12 months from March 2017 to March 2018, the median unit price increased by 5.3 per cent from $475,000. Metropolitan Melbourne sales statistics for the March 2018 quarter showed a decrease of 5.0 per cent to $725,000 for median house prices and a decrease of 3.2 per cent to $530,200 for median unit prices. For the 12 months to March 2017, median sales prices in metropolitan Melbourne showed increases of 6.6 per cent for houses and 4.7 per cent for units. In the March 2018 quarter, the median house price in country Victoria increased by 1.4 per cent to $360,000. Units decreased by 3.5 per cent to $275,000. Over the 12 months to March 2018, median sale prices in country Victoria showed a 7.5 per cent increase for houses and a 1.4 per cent increase for units. Of the 773 listed Victorian locations, 259 had median house price increases for the March 2018 quarter compared to 360 in the December 2017 quarter. Six localities recorded no change, 230 showed a decrease and 278 had insufficient sales. The maximum number of house sales for the quarter was 290 in Pakenham. There were 15 locations with 100 or more sales in the March 2018 quarter.
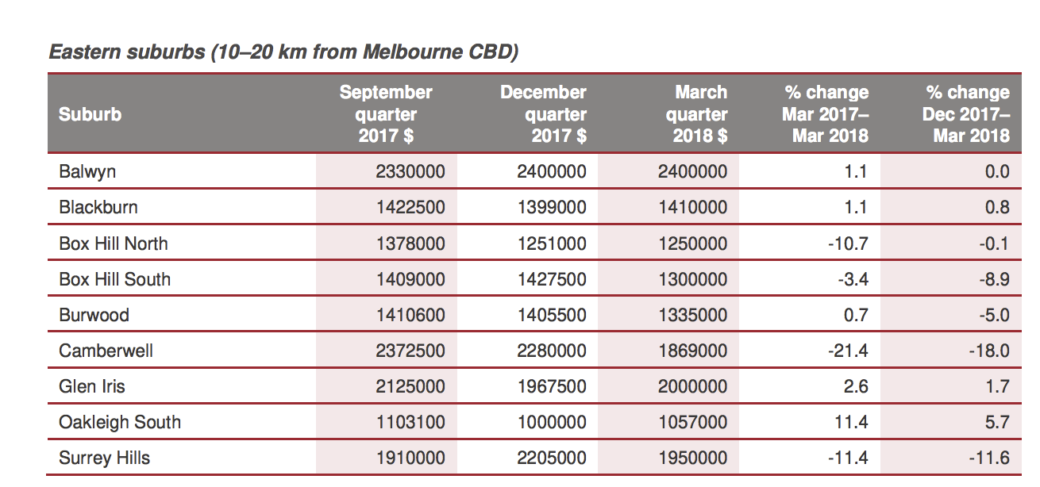
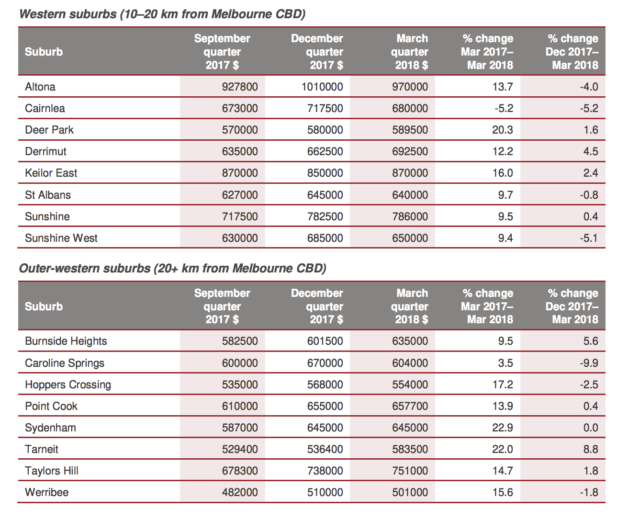
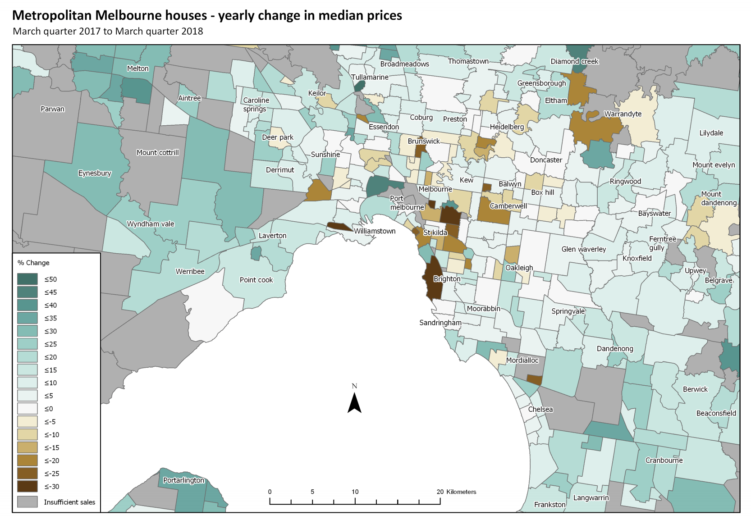
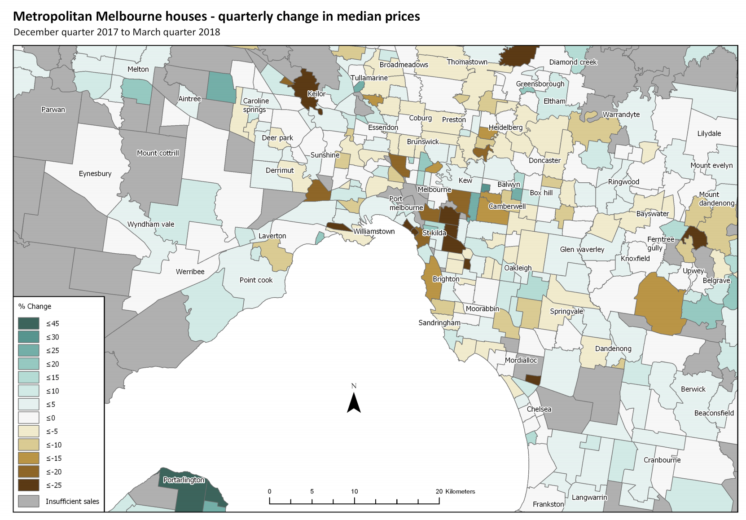
Quarterly update – median house prices
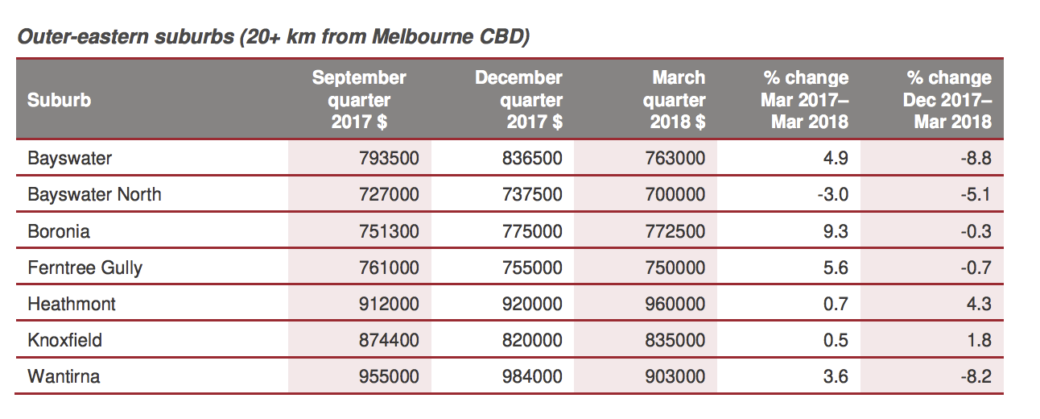
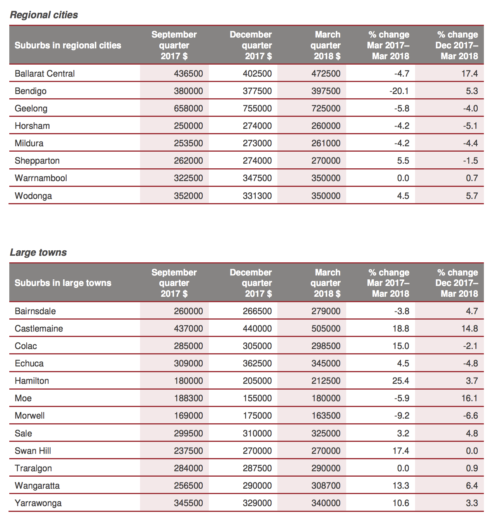
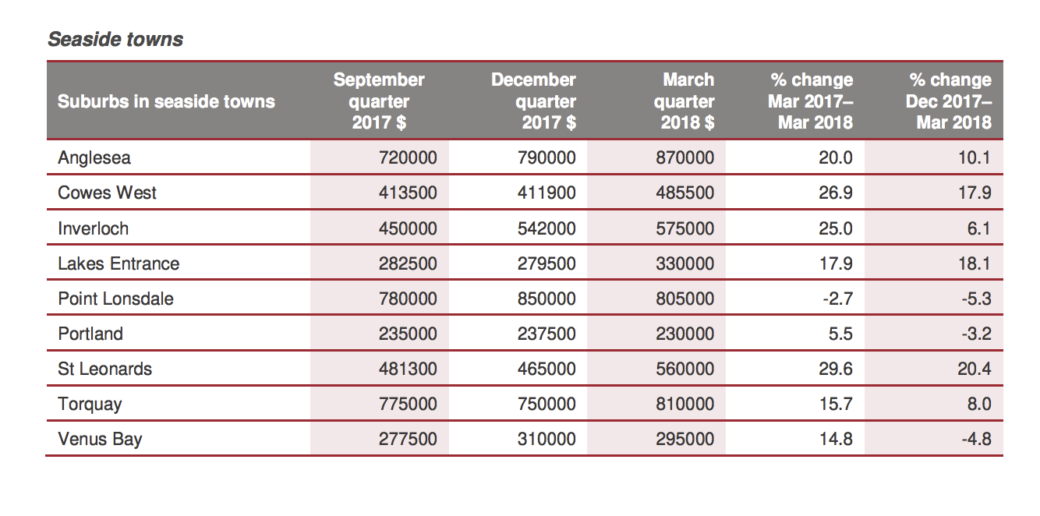
House sales data for the whole of Victoria for the quarter ending March 2018 indicates that the median house sale price decreased by 5.7 per cent to $595,000. Metropolitan house prices decreased by 5.0 per cent to $725,000 and country Victoria house prices increased by 1.4 per cent to $360,000. Quoting the highest and lowest increases and decreases for the quarter does not necessarily provide a definitive indication of the property market. However, the examples of sub-market groupings provided – defined by regional suburb location and township size – may be useful for analysis and comparison. The use of simple comparisons – increases and decreases in median prices between similar suburbs or towns – disregards the number of sales comprising the median and can be misleading in some instances. It should be remembered that suburbs and towns with higher numbers of sales provide the best guide to trends. Property analysts will be able to define and explain various locations’ trends using their knowledge of individual locations and their associated sub-market anomalies. This is the purpose of publishing a comprehensive set of data for the whole of Victoria, as reported to Land Use Victoria over the 15 months to March 2018. A sub-market group is a set of properties grouped by land values and other market characteristics or attributes common to the group, such as land use or building construction. It is estimated that almost 93 per cent of sales for the March quarter of 2018 and 98 per cent for the December quarter of 2017 are included in the data, making it the most comprehensive and authoritative property information available. By allowing extra time for data collection, the Victorian Property Sales Report provides an accurate picture of the property market, which offers certainty to government, the property industry, purchasers and sellers. The number of Victorian house sales so far recorded for the March 2018 quarter is 19,113. Using the above percentage, it is anticipated that the number of sales for the March 2018 quarter will be approximately 20,573. This is a 13.8 per cent decrease from the number of sales in the December 2017 quarter and a 0.3 per cent increase on the same quarter the previous year (March 2017). Metropolitan Melbourne House prices in metropolitan Melbourne decreased by 5 per cent in the March 2018 quarter, from $763,000 to $725,000. This follows an 8.2 per cent increase in the previous quarter. The number of metropolitan sales for the quarter is expected to culminate at 12,838, which is 21.1 per cent lower than the December 2017 quarter and 6.8 per cent lower than the March 2017 quarter. The data indicates that the driving factor in the 4.9 per cent decrease in metropolitan Melbourne housing values was localities within 20 km of Melbourne, predominately the inner-eastern suburbs. The data demonstrates the volatility in median house price changes and indicates the need for data analysts to undertake their own detailed research. It has been observed that fewer suburbs showed an increase in median house price in the March 2018 quarter compared to the December 2017 quarter (148 metropolitan suburbs with 10 or more sales show an increase in median house price for this quarter compared to 232 suburbs for the December 2017 quarter). Of the metropolitan suburbs with 10 or more sales in both of the last two quarters, 117 shifted from showing a median price increase for the December 2017 quarter to a median price decrease for the March 2018 quarter. For example, Bentleigh East increased by 4.6 per cent in the December 2017 quarter, while it decreased by 4.2 per cent in the March 2018 quarter. This compares to 75 metropolitan suburbs shifting from an increase in the September 2017 quarter to a decrease in the December 2017 quarter. Conversely, 53 metropolitan suburbs with 10 or more sales shifted from showing a median price decrease in the December 2017 quarter to a median price increase in the March 2018 quarter. This compares to 94 metropolitan suburbs shifting from a decrease in the September 2017 quarter to an increase in the December 2017 quarter. Thirty-eight metropolitan suburbs with 10 or more sales showed decreases for both the December 2017 and March 2018 quarters. Significant examples include Ivanhoe and Brunswick. This is compared to 25 metropolitan suburbs in the previous quarter. The largest median price increase in a suburb with 10 or more sales occurred in Bittern, which had 12 sales and rose by 30.4 per cent ($535,000 to $697,500). Toorak had the highest median price at $3,275,500, a decrease of 35.6 per cent for the 12 months from March 2017. The next biggest increase in the Melbourne metropolitan area occurred in Balcombe, which had 29 sales and rose by 27.3 per cent to $1,400,000.