Firstly, we pointed out that in Melbourne, the 5–10% drop we’ve seen so far followed a growth cycle that added 60–100% to property values overall. Many Australians owned property for the entire duration of this cycle and therefore have enjoyed the full benefit.

Next, we addressed the sensational and erroneous theory being bandied about by some purported experts that there is another 40% drop in values to go. There is zero chance we will see a collapse like this. There would have to be a global economic ice age to generate this sort of slump and then it wouldn’t matter where your cash was tied up, we’d all be in trouble! The fundamentals underpinning property values in Australia remain solid. Rock solid. What we are seeing now is an important part of every major asset cycle – a correction in values after a sustained period of growth. Remember, it was only Sydney and Melbourne that had significant growth (over 50%) in recent years.
The rest of Australia has had pretty subdued price increases post-GFC. I’ve heard the “40% overvalued” theory four times in my 35 years in property. It’s like the same groups are chasing the same headline impact every time the market corrects. Not once has this provocative prediction come true – or even close to it. It won’t this time, either.
So, what’s next? Melbourne prices might correct by another 5% to a maximum of around 10%. In 2019, we see the strong possibility of a mini rebound as buyer demand grows at adjusted pricing levels. It’s impossible to pick the top or bottom until they are behind us but my instincts tell me the market has corrected quickly and we are within a few percentage points of new price benchmarks. Only three things could change this. A spike in interest rates over the next 24 months, which would return us to the long-term average of around 7%. Banks tightening lending even further. Unemployment escalating rapidly. None of these are likely to happen. I believe the worst of this correction is already over and we’re in for a much softer landing than many pundits predicted. Meanwhile, it couldn’t be a better time for first home buyers. With the bank of mum and dad by their side, along with generous stamp duty concessions and government savings initiatives, there are excellent opportunities to get a foot in the door after a long period of difficulty. Within the broader market, I believe there is still solid demand across most price points but lending restrictions are ruling many buyers out. In the long run, it’s strengthening our broader financial system but the market needs time to adjust.
Shift happens
Melbourne’s boom followed Sydney, with a 59%13 surge in home values over the growth cycle to its November 2017 peak. Properties retained their worth in FY18 with 1%14 growth but this was all but wiped out with an -2.4% fall in the first quarter of FY19.12 Whilst affordability and declining investor activity are key drivers – as is usual at the end of booms, it is the engineered changes to lending that have arguably had the biggest impact on the market below $5 million.
Greater scrutiny of borrowers’ personal expenses and debt to income ratios were implemented virtually overnight in 2018 and affected almost every buyer. The impact on market momentum was quick and dramatic in comparison to normal cooling forces such as affordability and rising interest rates, which tend to have a much more gradual effect.
Senior economists at ANZ Research have suggested a correction of -10% for both markets.17 This is far from a gloomy outlook and no bust by any learned person’s measure. Cyclical price corrections must occur to ensure the long term stability of our property markets and the broader national economy. The fundamentals of Australian real estate will continue to underpin property prices through the volatility of this shift period. We are still undersupplied, population growth is high and unemployment remains low in Melbourne at 6.8% 。
City Spotlight Melbourne
Following 51% growth in home values over five years,52 Melbourne’s boom finally peaked in November 2017 – five months later than Sydney, with its cooling phase starting slowly but gathering pace in mid-2018. Properties retained their value in FY18 with 1% growth,53 however overall buyer demand is clearly weaker, primarily amongst investors but increasingly also owner occupiers as tightened lending criteria takes hold of the market.
In the 12 months to June 2018, the number of homes listed for sale remained roughly the same as the previous year, however sales fell by -16.8%54. At the end of FY18, Melbourne’s median house price was $821,000 and the median apartment price was $574,000.55 As always in a slowdown, the citywide market has become patchy with prices in outer areas continuing to grow while the inner and middle Melbourne markets broadly taper off. CoreLogic56 figures show top quartile values have fallen -4.1% over the past 12 months while the lower quartile has grown by 7.5%. Entry level suburbs with houses under $600,000 are drawing strong interest from first home buyers aided by Following 51% growth in home values over five years,52 Melbourne’s boom finally peaked in November 2017 – five months later than Sydney, with its cooling phase starting slowly but gathering pace in mid-2018.
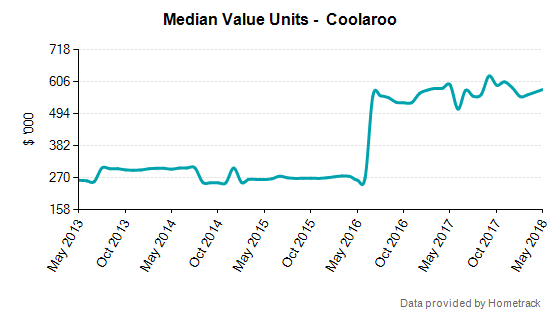
Properties retained their value in FY18 with 1% growth,53 however overall buyer demand is clearly weaker, primarily amongst investors but increasingly also owner occupiers as tightened lending criteria takes hold of the market. stamp duty concessions and the new $50 million HomesVic co-purchasing program, whereby the government takes a 25% equity share to increase affordability for buyers and reduce the need for larger deposits. Official figures show 250 buyers have provisional approval to buy via the pioneering program, which offers up to 400 properties in Melbourne suburbs including Dandenong, Ringwood and Sunshine, and regional hubs including Ballarat, Bendigo and Geelong.57 Nine of Melbourne’s top 10 suburbs for median house price growth in the year to June 2018 were located in the middle to outer ring areas in the sub-$700,000 price range. The best performers were Coolaroo (37%), Melton South (32%), Melton (27%), Sanctuary Lakes (29%) and Sunbury (26%).58 Family buyers are also fuelling strong construction activity in the city’s outer east, north and west at the rate of 1,500 new family households per week, according to the Housing Industry Association.
A longstanding correlation between property prices and school zones means homes in sought-after districts should somewhat defy the slowdown, particularly given the premium families are willing to pay. Real Estate Institute of Victoria (REIV) sales figures for CY1760 show houses in popular public school catchments were up to $400,000 more expensive than homes just outside the zone. Examples include South Yarra Primary (median house price $410,000 higher than homes 1km outside the zone),